Set Up Watcher
After deploying to a cluster, ask Monk to set up monitoring: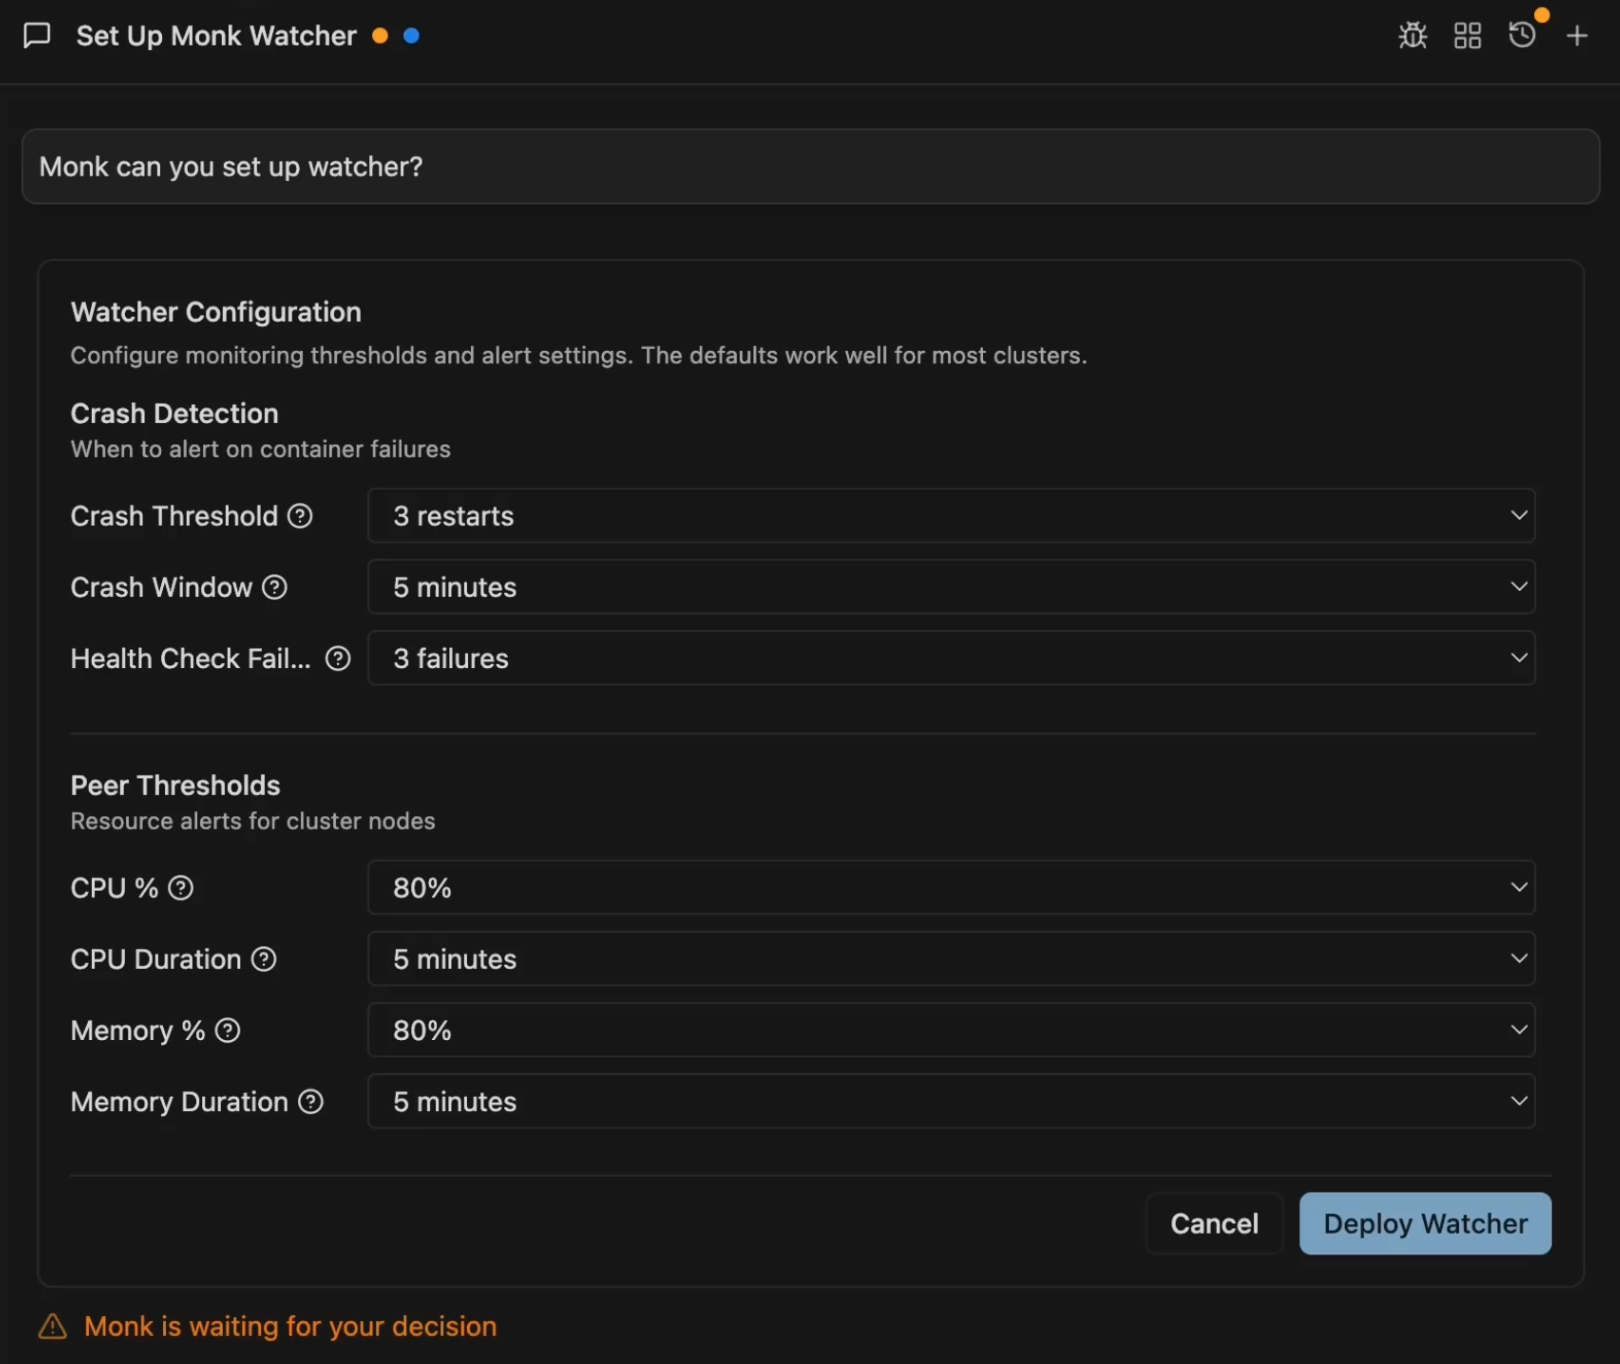
Watcher is available on the Pro and Team plans.
What Happens
- Monk deploys the watcher-agent and watcher-ai components to your cluster
- If you have a Slack webhook configured, alerts are sent there
- Watcher monitors nodes and containers continuously
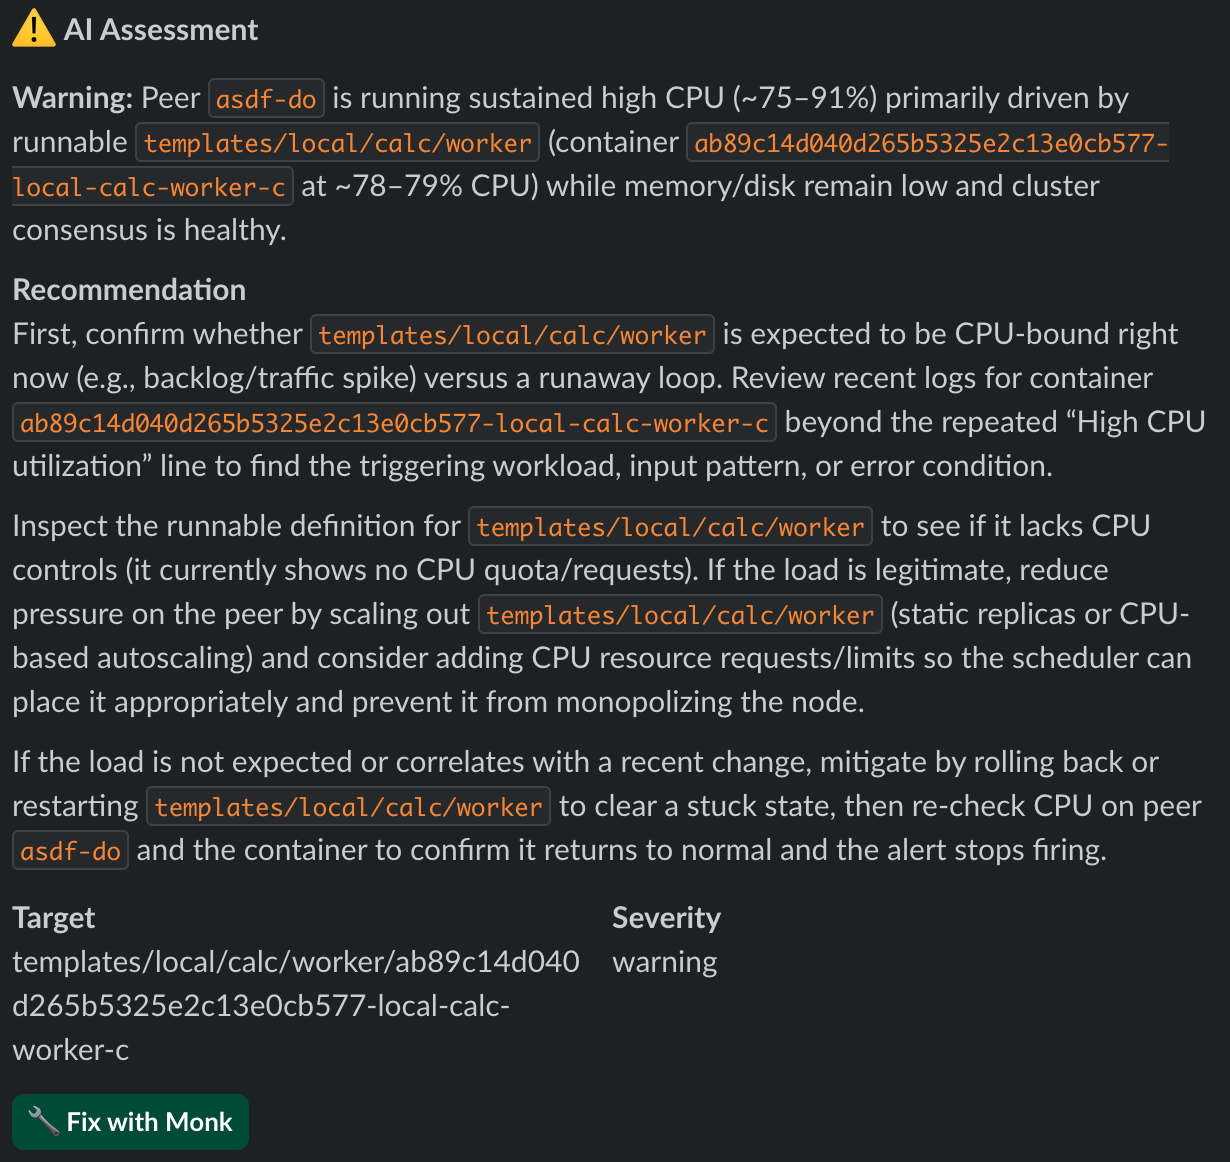
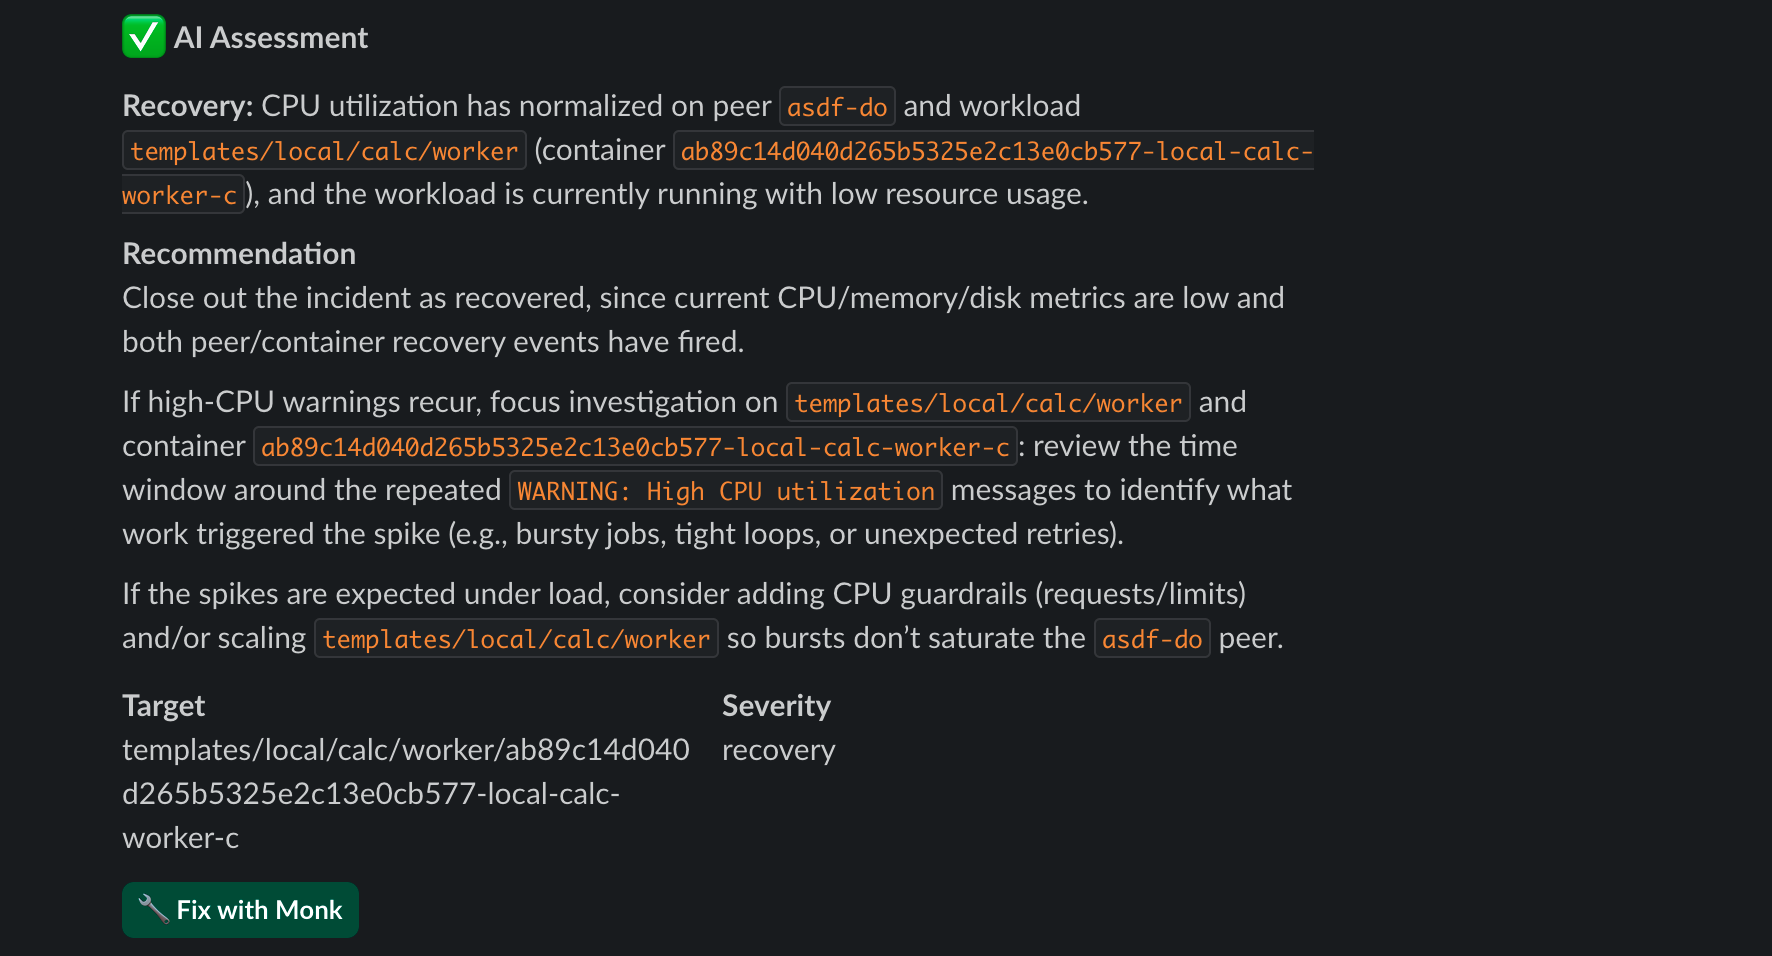
- When issues are detected, AI analyzes them and sends recommendations
- Each Slack alert includes a Fix with Monk button
Slack Alerts
When prompted, you can configure Slack alerts:- Monk opens a browser window where you authorize the Slack webhook
- You pick a Slack channel for alerts
- Monk connects everything automatically — no manual webhook URLs needed
Example Alerts
Issue detected: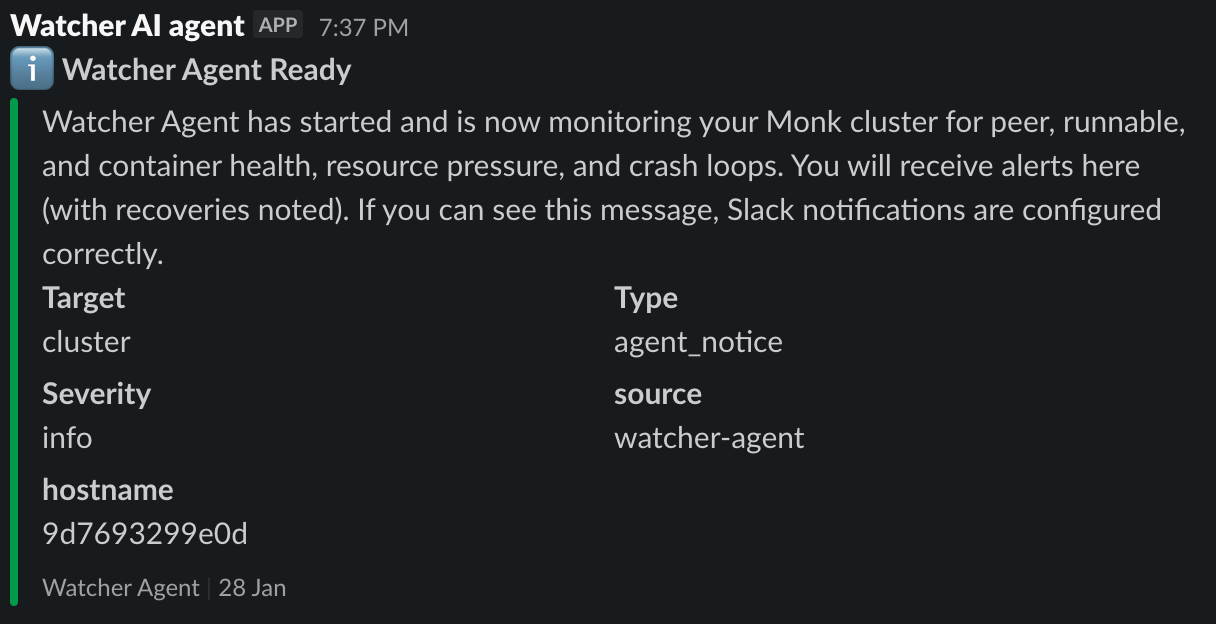
Fix with Monk Button
Click Fix with Monk in any Slack alert to:- Open your coding agent
- Load the chat or agent panel with full issue context
- Ask Monk to fix the issue