What It Does
Watcher runs on your cluster 24/7. It catches crashes, resource spikes, and health check failures. When something breaks, it figures out why and sends you a Slack alert with a diagnosis and a fix button. That’s it. No dashboards to babysit, no runbooks to follow, no pager rotation. Available on Pro and Team plans.Setup
Tell Monk to set up Watcher:- An active cluster with at least one non-local node
- A Slack workspace (optional — Watcher works without it, but you won’t get push notifications)
How It Works
Watcher deploys two components to your cluster:- watcher-agent — polls your nodes and workloads, collects metrics, spots problems
- watcher-ai — analyzes what went wrong, writes recommendations, fires Slack alerts
- Detect. Continuous polling catches a threshold breach, crash loop, resource contention, excessive logs, or infrastructure instability.
- Analyze. AI reads the logs, metrics, and context. It figures out what happened and why.
- Alert. You get a Slack message with the diagnosis, severity, and a recommended fix.
- Fix. Click Fix with Monk in the alert. Monk opens a chat session preloaded with full context and starts remediation.
- Recover. When the issue clears, you get a recovery notification.
Slack Alerts
During setup, Monk asks if you want Slack alerts. Say yes and Monk opens a quick OAuth flow — you authorize in Slack, pick a channel, and you’re done. No manual webhook URLs needed. Skip Slack if you want. Watcher still monitors everything — you just won’t get push notifications.Watcher alerts are separate from the Slack remote control feature. Alerts are one-way notifications. Remote control is two-way interactive prompts for questions, forms, and approvals.
Slack Alert Format
Issue detected:Fix with Monk Button
Every alert includes a Fix with Monk button. Click it and:- Your coding agent opens with Monk ready
- The chat panel loads with full context — affected workload, logs, metrics, AI diagnosis
- You tell Monk to fix it. It already knows what’s wrong.
Watcher Credits
Watcher is available on Pro and Team plans, and it’s the only part of Monk that consumes watcher credits. Each account starts with 50 watcher credits from the free trial. Deploying, chatting with Monk, and the Monk plugin’s everyday operations do not use watcher credits - only Watcher’s monitoring, diagnosis, and repair cycles do. For current pricing, visit Monk Pricing.Configuration Options
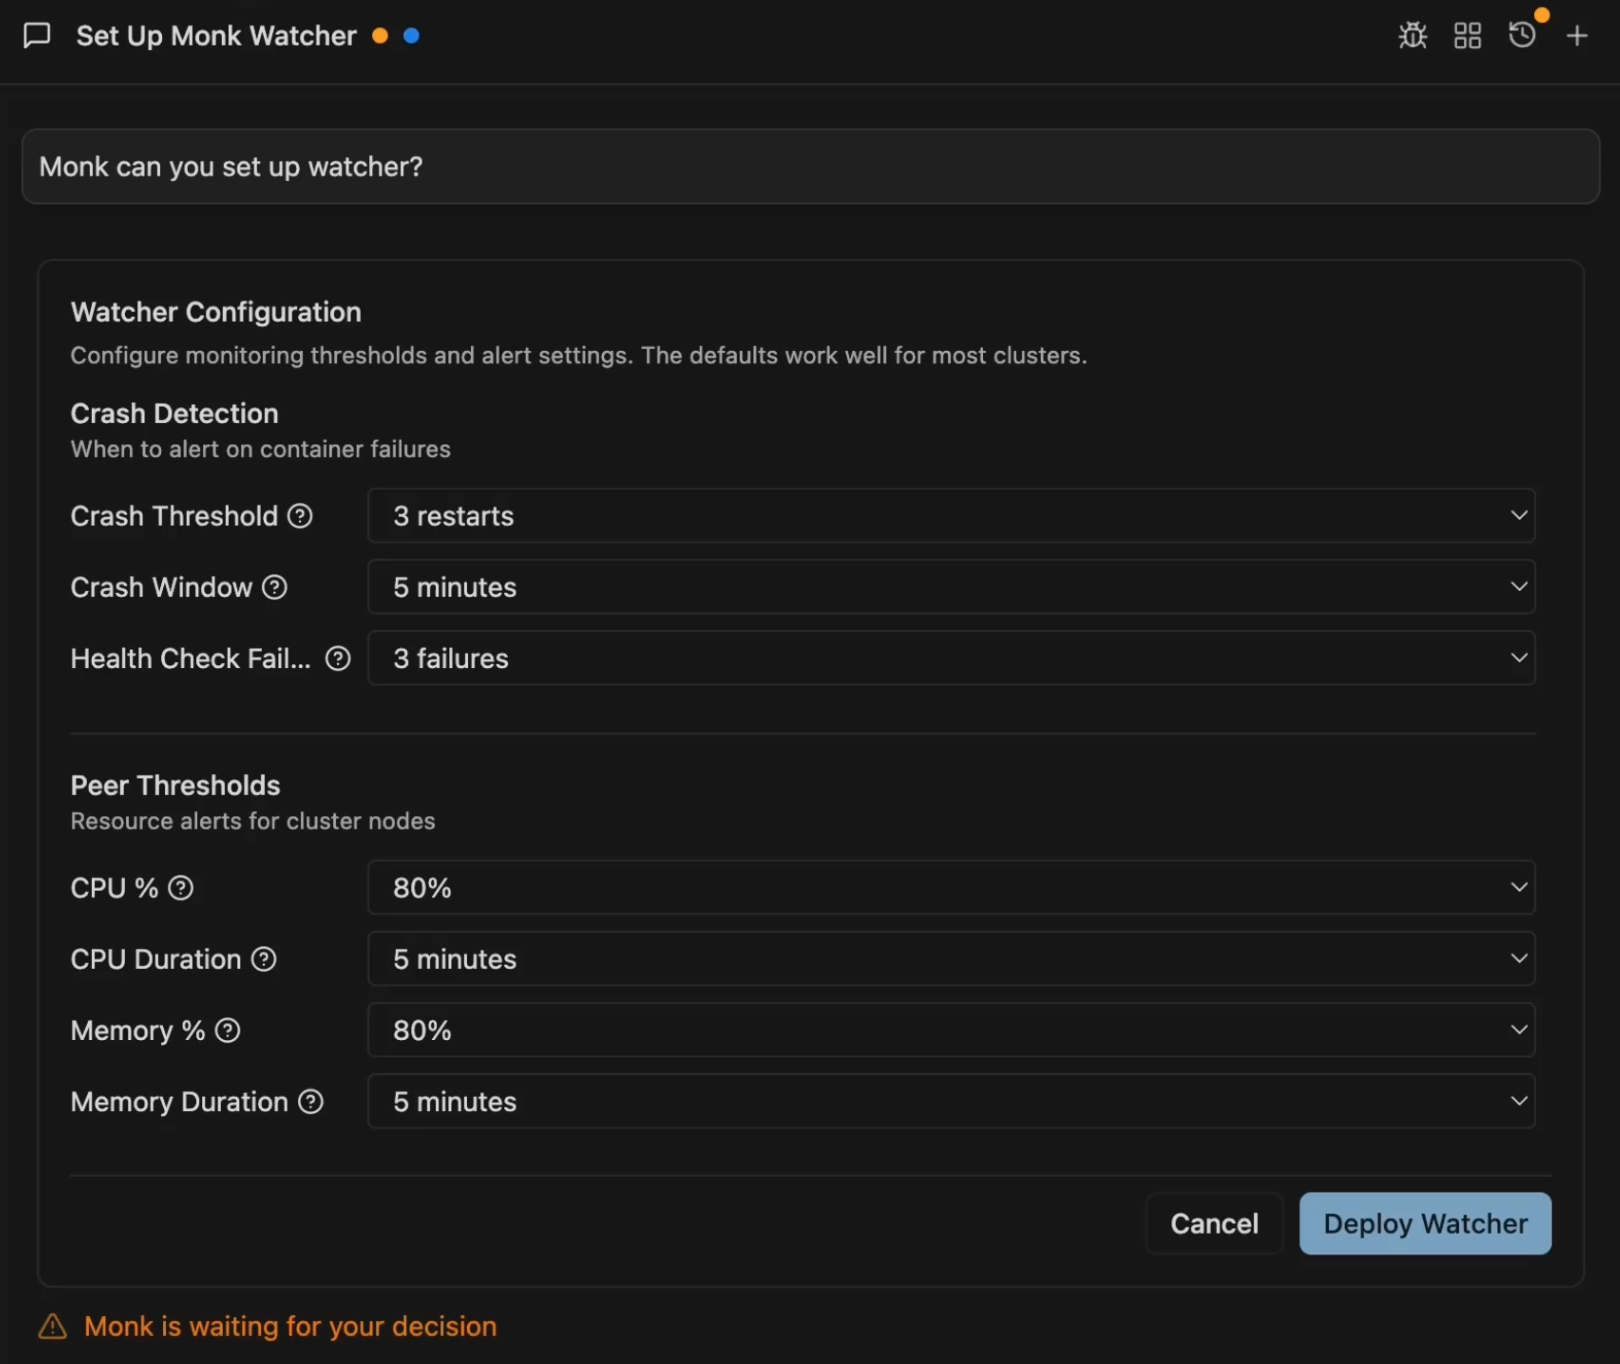
The setup form has four sections:Crash Detection
- Crash Threshold: Restarts within the window to trigger an alert (default: 3)
- Crash Window: Time window for counting restarts (default: 5 minutes)
- Health Check Failures: Consecutive liveness failures before alerting (default: 3)
Peer Thresholds (Cluster Nodes)
- CPU %: Usage threshold (default: 80%)
- CPU Duration: Sustained time before alerting (default: 5 minutes)
- Memory %: Usage threshold (default: 80%)
- Memory Duration: Sustained time before alerting (default: 5 minutes)
- Disk %: Usage threshold (default: 85%)
- Disk Breaches: Consecutive polls above threshold before alerting (default: 2)
Workload Thresholds (Running Services)
- CPU %: Usage threshold (default: 80%)
- CPU Duration: Sustained time before alerting (default: 5 minutes)
- Memory %: Usage threshold (default: 80%)
- Memory Duration: Sustained time before alerting (default: 5 minutes)
- Disk %: Usage threshold (default: 90%)
- Disk Breaches: Consecutive polls above threshold before alerting (default: 3)
Advanced Settings
Toggle “Show Advanced Options” to access:- Poll Interval: How often to check cluster health (default: 15 seconds)
- AI Only Slack: Only send AI-analyzed alerts to Slack, cuts noise (default: on)
- Enable Fix with Monk: Include debugging links in Slack alerts (default: on)
- Ignore Local Peer: Skip local node checks, focus on remote peers (default: on)
- Context TTL: How long to keep alert context for debugging links (default: 24 hours)
- Reassess Interval: How often to re-evaluate ongoing issues (default: 15 minutes)
- Log Lines: Number of log lines to analyze per workload (default: 100)
Managing Watcher
Check status:Autonomous auto-fixes — automatic restart, auto-scaling, smart rollback — are on the roadmap. Vote on what to prioritize.
Monitoring & Observability
Log streaming, metrics, and troubleshooting from your IDE.
Scaling
Scale resources when Watcher detects sustained pressure.